BrightScript Profiler is a tool created for collecting and analyzing channel metrics that can be used to determine where performance improvements and efficiencies can be made in the channel.
Table of Contents
The BrightScript profiler provides the following metrics for a channel:
- CPU Usage: Determine where BrightScript code execution is happening
- Wall-Clock time: Determine where the most time (execution and waiting) is being spent when a channel is running
- Function call counts
- Memory usage, including memory leak detection – Available since firmware version 9
Each of the above metrics can be used to diagnose problems and provide guidance to the channel developer to improve channel performance.
Usage
The workflow of the BrightScript Profiler is as below:
- Add at least the required manifest entries to the channel to run the profiler
- Run and then Exit the channel to generate data and metrics
- Save the profiling data to the device or stream it to the machine (PC) you are using for development
- Analyze the profiling data as necessary
Manifest entries
Below is the list of manifest keys used by the profiler:
Manifest Key | Value Type | Legal Values | Default Value | Required | Description |
|---|---|---|---|---|---|
bsprof_data_dest | enum | local , network | local | Yes | If this entry value is If this entry value is |
bsprof_enable | boolean | 0 , 1 | 0 | Yes | Turns on BrightScript Profiling when the channel is running. This is the master flag and must be set to 1 for any other profiling options to take effect. |
bsprof_enable_lines | boolean | 0 , 1 | 0 | No | Collects memory and CPU data for each line of BrightScript source code. This makes it easier to pinpoint memory and CPU usage issues. This value is set to 0 by default, which means that data is collected for each BrightScript function as a whole. Enabling this feature can have a significant impact on device performance. Requires BrightScript profiling to be enabled (bsprof_enable=1), and the RSG version to be set to 1.2 (rsg_version=1.2). Available since firmware version 9.1 |
bsprof_enable_mem | boolean | 0 , 1 | 0 | Yes, if using memory profiling | Turns on memory profiling. Requires BrightScript profiling to be enabled ( If this is enabled, the |
bsprof_pause_on_start | boolean | 0 , 1 | 0 | No | Immediately after launching the channel, profiling is paused until manually resumed with the Requires BrightScript profiling to be enabled ( |
bsprof_sample_ratio | float | 0.001 to 1.0 | 1.0 | Yes | Sets how often profiling samples are taken, while the channel is running. Only has effect if The |
| float | 1.1,1,2 |
| No | To use line-level profiling, this must be set to 1.2 (rsg_version=1.2). If it is not set to 1.2, profiling will still work correctly; however, line-level data will not be generated. rsg_version 1.2 provides significant performance improvements; therefore, you should set it to 1.2 regardless whether your channel is using line-level profiling. See Roku Channel Manifest for more information. |
Running the profiler on a channel
To initiate the memory profiler, sideload, run, and then exit the channel. The profiling data is complete only after the channel exits.
Pausing and resuming profiling
Channel profiling can be paused and resumed at any time. Use the following commands on port 8080 to either pause or resume the memory profiler:
bsprof-pause
bsprof-resume
If the profiler is paused, very little data is written regardless of the data destination. This allows the profiling data (generally, the data relevant to specific parts of a channel's UI or other operation) to be collected and analyzed later. These two commands are particularly useful when combined with the bsprof_pause_on_start manifest entry.
Manifest entry:
bsprof_pause_on_start=1
For example, if starting video playback is slow or seems to cause memory leaks, the bsprof_pause_on_start=1 entry can be set in the channel's manifest. After the channel is launched, but prior to video playback, execute the bsprof-resume command on port 8080 to begin collecting profiling data. After performing the UI operations to be profiled, execute the bsprof-pause command to suspend the storing operation of the profiling data. Then, exit the channel to make the profiling data available for analysis. In this scenario, the profiling data will pertain specifically to the operations performed between bsprof-resume and bsprof-pause.
Port 8080 Commands
These profiling commands exist on port 8080 (Roku OS Versions 9 and later):
Command | Purpose |
|---|---|
bsprof-status | Get the status of BrightScript profiling |
bsprof-pause | Pause the generation of profiling data |
bsprof-resume | Resume the generation of profiling data |
Collecting the data
The channel's manifest entry bsprof_data_dest determines how the profiling data is retrieved from the device. The data can be stored locally on the device and downloaded after the channel finishes running and exits, or it can be streamed over a network connection while the channel is running. Streaming consumes significantly less memory on the device while the channel is running. In addition, if the channel fails, the memory data will have been accurately collected up until the time of the crash (CPU data, however, is typically lost if a failure occurs).
Data Destination: Local
Local data storage is the default storage for profiling, though it can be explicitly selected by adding bsprof_data_dest=local to the channel's manifest. When using this destination, the data becomes available on the device's Application Installer after the channel exits:
- Launch the channel and run through the test cases. Once the channel finishes running and exits, open Roku device's Developer Settings and click on Utilities.
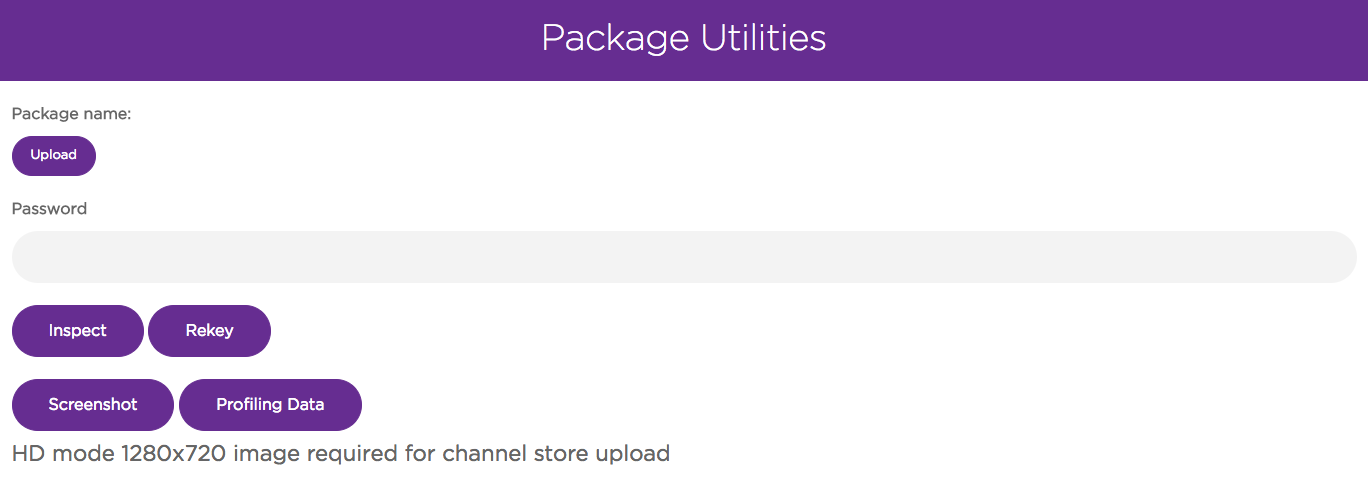
Click Profiling Data to generate a
.bsproffile and a link to download the data from your Roku device.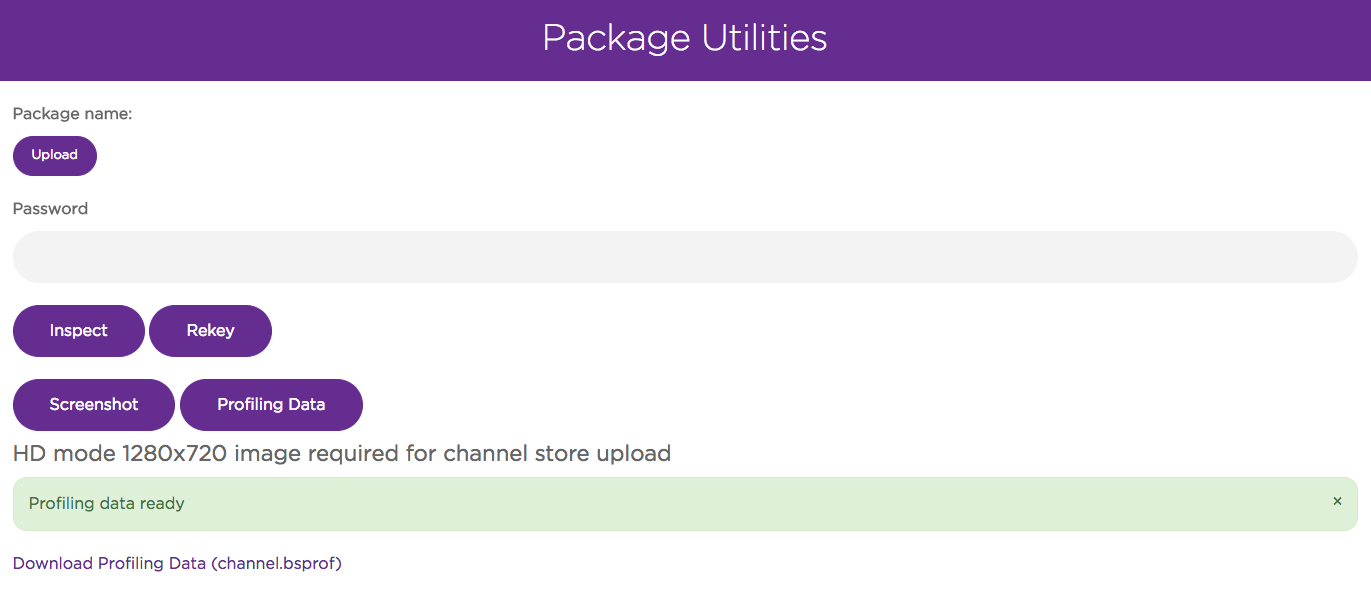 The
The.bsprofformat is unique to Roku to ensure the format is as efficient and small as possible and easy to generate even on low-end Roku devices.
Data Destination: Network
Available since firmware version 9
In order to stream a channel's profiling data to a network while the channel is running, add bsprof_data_dest=network to the channel's manifest. Streaming data over the network is especially useful when profiling a channel's memory usage because all memory operations are included in the profiling data, and the amount of space necessary to store the data can be very large. By streaming the data to a network, the data size is limited primarily by the host computer receiving the data, and not by the available memory on the device itself. Even while streaming the profiling data to the network, there are still additional demands placed on the device's resources while profiling as compared to running a channel without profiling. However, the use of resources on the device is significantly reduced.
When this feature is enabled, the start of the channel is delayed until a network connection is received by the device, which is the destination for the data. When the channel is launched, a message similar to the following appears on the port 8085 developer console:
08-31 23:15:29.542 [scrpt.prof.connect.wait] Waiting for connection to http://192.168.1.1:8090/bsprof/channel.bsprof
The URL is used with wget, curl, or a web browser. Once a connection is received from one of those programs, the following message appears on the developer console:
08-31 23:15:38.939 [scrpt.prof.connect.ok] profiler connected
When the channel exits, the following message appears on the developer console:
08-31 23:16:04.774 [scrpt.prof.save.ok] Profiling data complete, sent via network
Once that message is seen, the profiling connection is closed by the device and the remote file is populated with profiling data.
Viewing profiling data
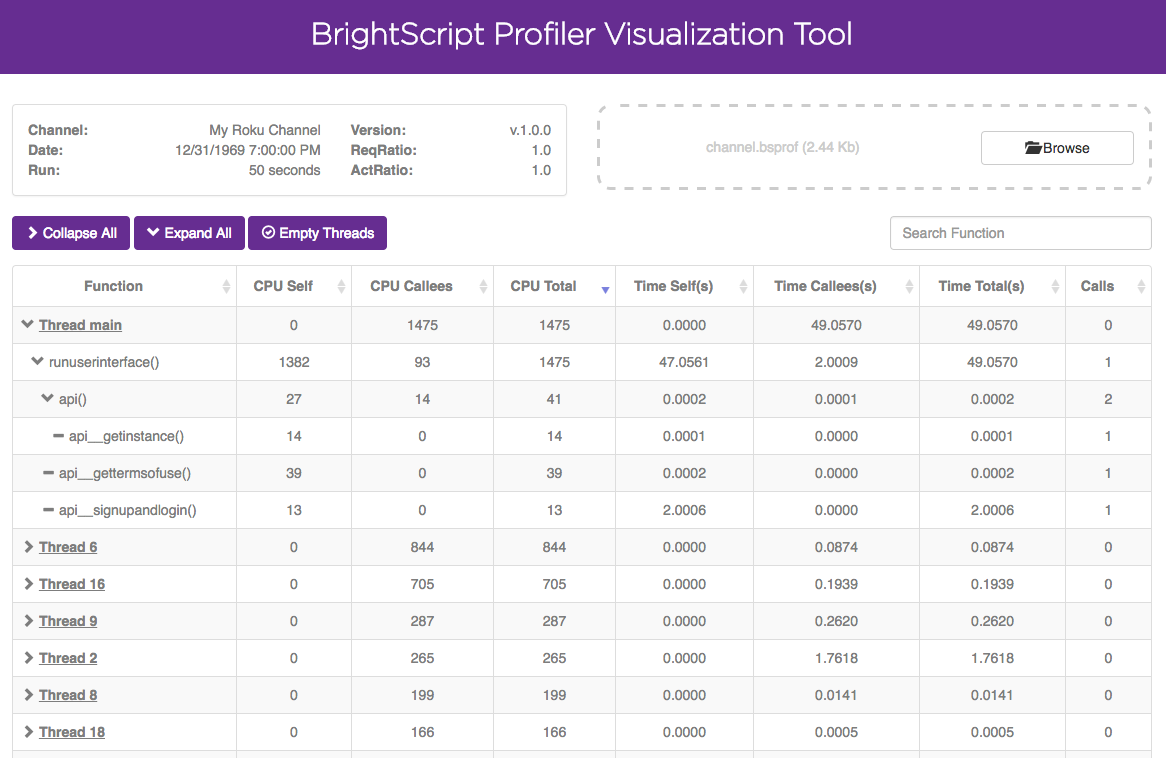
After downloading the .bsprof file, the data can be viewed using the BrightScript Profiler Visualization Tool. The tool lists the function calls in each thread. For SceneGraph applications, each thread corresponds to either the main BrightScript thread or a single instance of a <component>. For example, if you have a Task node that is instantiated multiple times, each instance will appear as a separate thread. The results are the same for any custom <component> in the channel that is instantiated multiple times. The main BrightScript thread (Thread main) is also represented as a single thread even though it has no <component>.
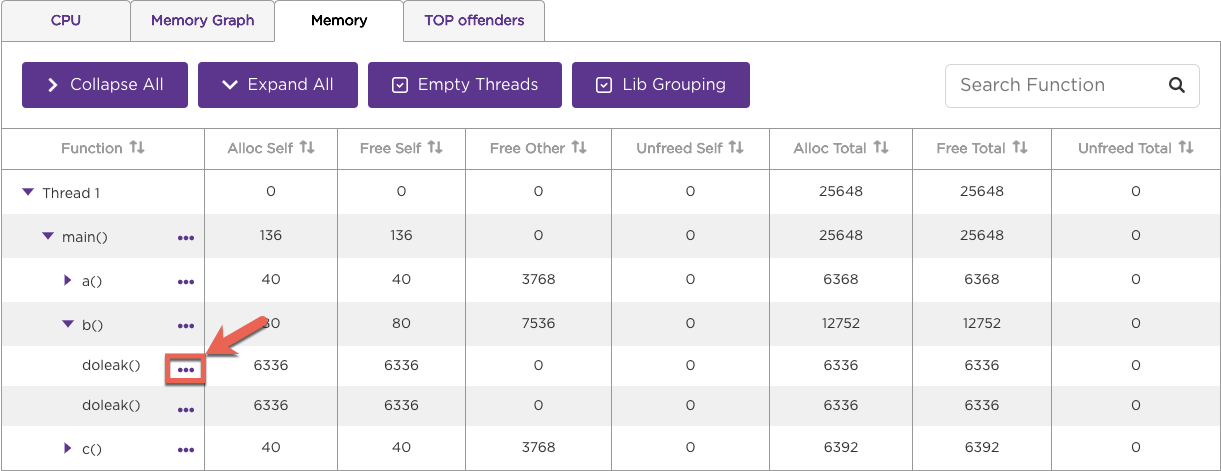
For each function listed in the tool, you can expand it to drill down further into its call path and get more detailed data on the function. If you enabled line-level profiling for the channel, you can also click on the ellipses to the right of a function to view profiling data for the individual lines of code within a function.
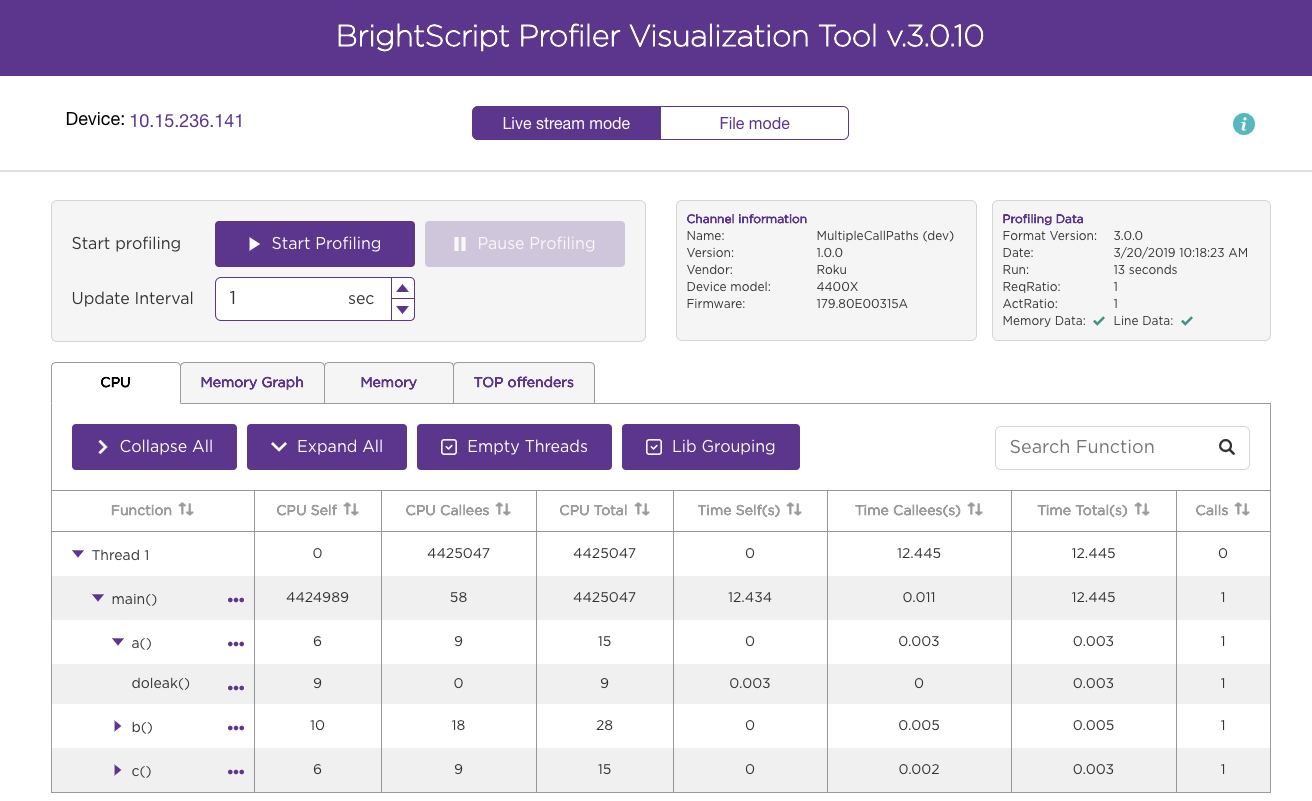
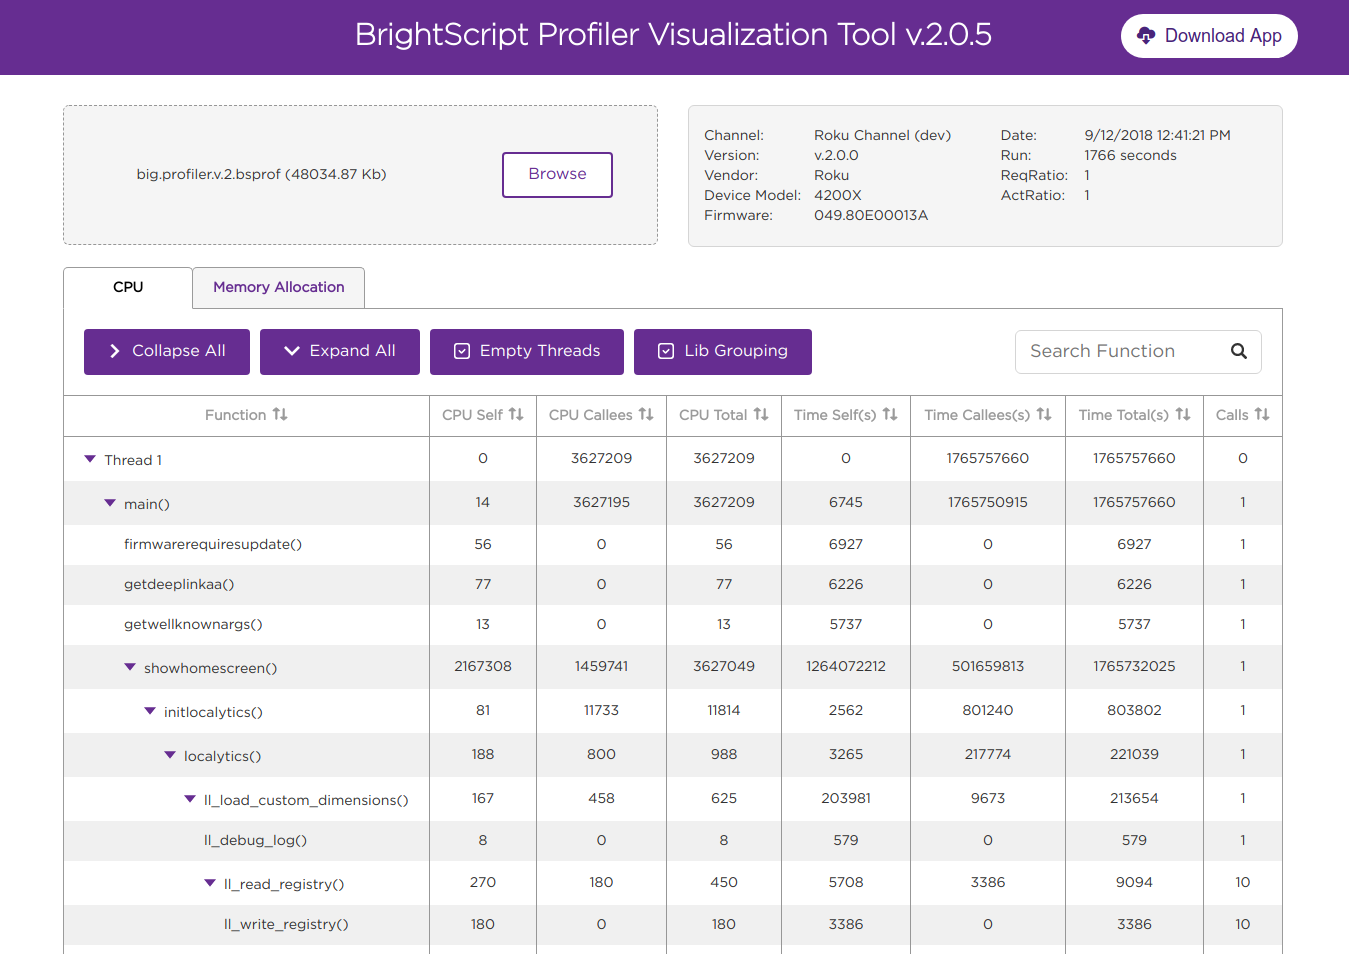
CPU
The CPU tab lists CPU time, wall-clock time, and call count statistics for each function observed and for the function's associated call path (expand a function to view its call path). CPU time refers to the number of operations each function takes to complete; this number should be equal on the low end and high-end Roku devices. Wall-clock time refers to the real world time that a function takes to complete. This value can vary across different Roku devices. For example, a function may take an equal number of operations to complete across different Roku devices but low-end Roku devices can take more real-world time to complete one operation than a high-end Roku device.
The CPU and wall-clock time columns are further divided into separate sections for self, callees, and total:
- self. The CPU/wall-clock time the function consumes itself.
- callees. The amount of CPU/wall-clock time consumed by any functions called by the original function.
- total. The amount of CPU/wall-clock time consumed by the original function (self) and any callee functions.
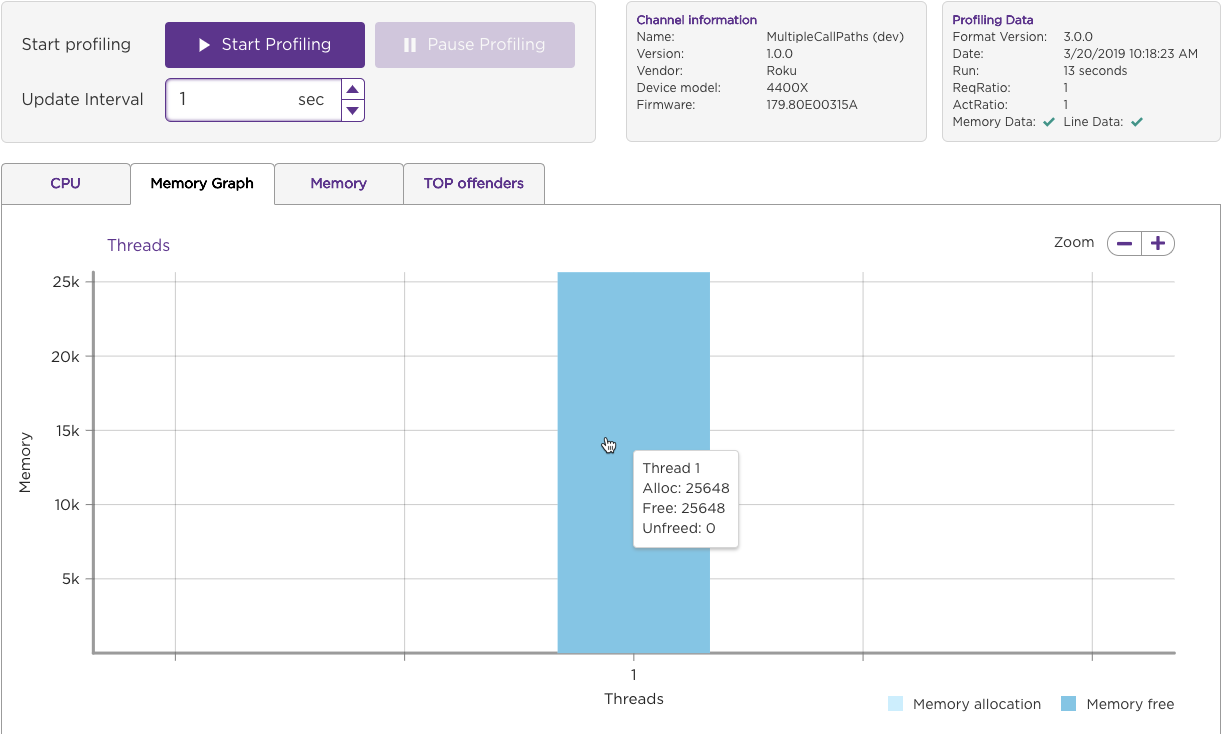
Memory Graph
The Memory Graph tab visualizes the memory consumption for each thread in the channel application. Move the mouse pointer over a column to view the allocated, free, and unfreed memory for the thread.
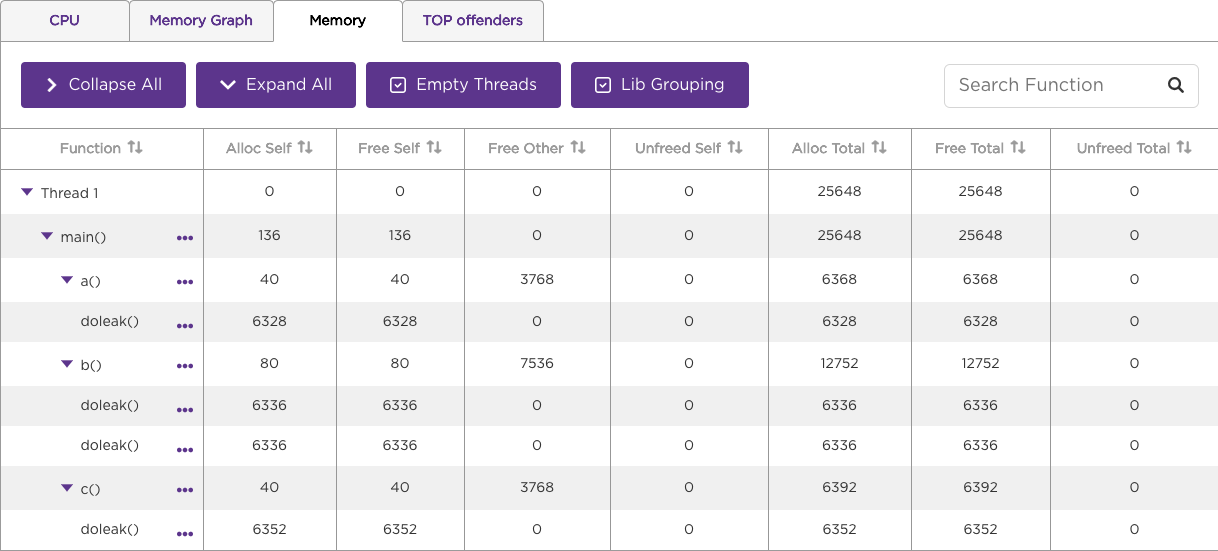
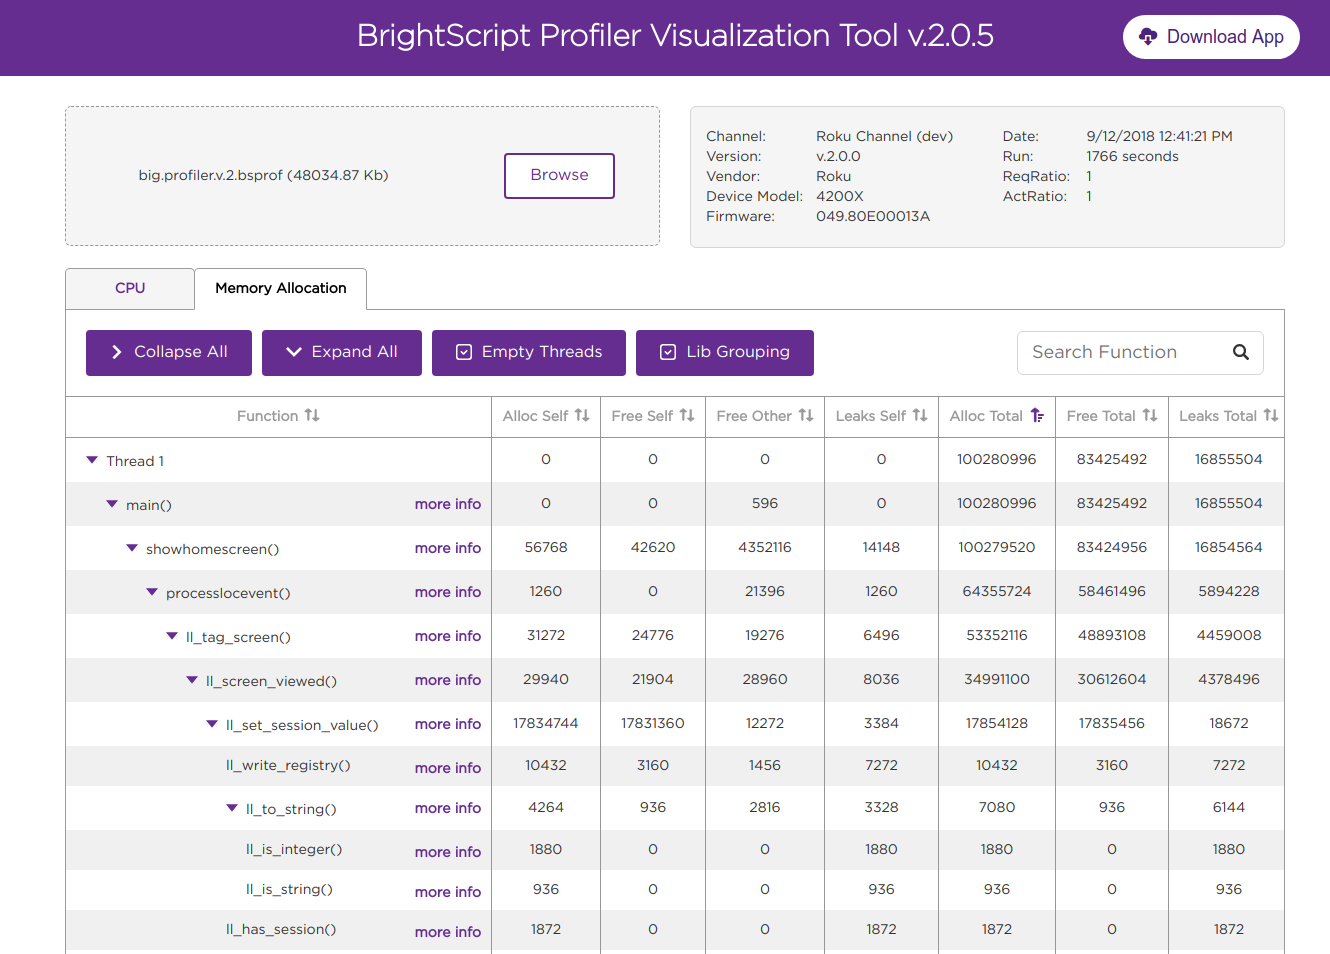
Memory
The Memory tab lists allocated, freed, and unfreed memory statistics for each function observed (self) and for the function's associated call path (total). See Profiling Values for more information on the memory statistics displayed in this tab.
Line-Level profiling
You can collect profile data for each line of BrightScript source code to better pinpoint high CPU and memory usage. To do this, enable profiling (bsprof_enable=1), line-level profiling (bsprof_enable_lines=1), and RSG version 1.2 (rsg_version=1.2) in the channel manifest. In the CPU or Memory tab, click on the ellipses to the right of the function to drill down into its individual lines of code.
The BrightScript Profiler lists the CPU or memory usage at the time the individual lines of code in the function were executed.
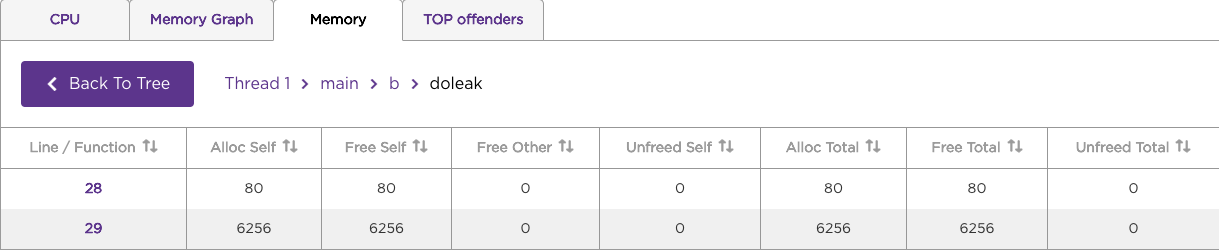
See Profiling Values for more information on the CPU and memory statistics displayed in the tool.
Profiling Values
The following table describes the profile statistics displayed in the BrightScript profiler tool. The descriptions are applicable for the functions as a whole or for individuals lines of code in the functions (if using line-level profiling).
Calls | Number of times a function was called |
Cpu.self | CPU* used by the function itself |
Cpu.callees | CPU* used in functions called by a function |
Cpu.total | Cpu.self + cpu.callees |
Mem.self | Memory allocated within a function itself, but not freed (leaks) |
Mem.callees | Memory allocated by functions called by a function, but not freed (leaks) |
Mem.total | Mem.self + mem.callees |
Tm.self | Real (wall-clock) time spent on the function itself |
Tm.callees | Real (wall-clock) time spent on functions called by a function |
Tm.total | Tm.self + tm.callees |
Avg.cpu_self Avg.cpu_callees Avg.cpu_total Avg.mem_self Avg.mem_total Avg.tm_self Avg.tm_callees Avg.tm_total | Average of the metric, over the number of calls (e.g., if cpu.self=100 and calls=2, avg_cpu_self will be 50) |
A “memory leak” is simply any memory that is allocated, but not freed while the profiler was running. If memory is freed while profiling is paused, the free memory is not tracked and the memory may show up as “leaked.”
Time is measured as if a stopwatch were used to time the action. For example, if a function makes a network call, there may be very little CPU time used, but a significant amount of time waiting for the network response.
If any of these metrics appear in a call path, they are specific to that call path. For example, in this call path:
<root>: cpu.self=0,cpu.callees=14700,tm.self=0.000,tm.callees=1.989,mem.self=0,mem.callees=324452,calls=0+- func1(): pkg:/components/file1.brs:83,cpu.self=200,cpu.callees=14500,tm.self=0.728,tm.callees=1.261,mem.self=5840,mem.callees=318612,calls=1| +- func2(): pkg:/components/file2.brs:22,cpu.self=14500,cpu.callees=0,tm.self=1.261,tm.callees=0.000,mem.self=31800,mem.callees=612,calls=1 |
The metrics for func2() are specific to when it is called from func1().
However, in the table below:
------------- BEGIN: TOP CONSUMERS: CPU.SELF ----------------- 1: func1(): pkg:/components/file1.brs:83,cpu.self=300,cpu.total=450,tm.self=0.001,tm.total=0.001,mem.self=0,mem.total=0,calls=5 2: func2(): pkg:/components/file2.brs:22,cpu.self=55430,cpu.total=80500,tm.self=0.126,tm.total=0.126,mem.self=0,mem.total=0,calls=3-------------- END: TOP CONSUMERS: CPU.SELF ----------------- |
Top Offenders
The Top Offenders tab displays the functions or function call paths that used the greatest amount of CPU, memory, or time. This tab is typically the best place to start diagnosing potential performance issues. The top 10 functions with the most unfreed memory are listed by default. You can change the report to a top 20, 100, 500 list or enter a custom depth, and you can select which metric to view. For example, the top 5 methods with the highest total CPU time are displayed in the following image:
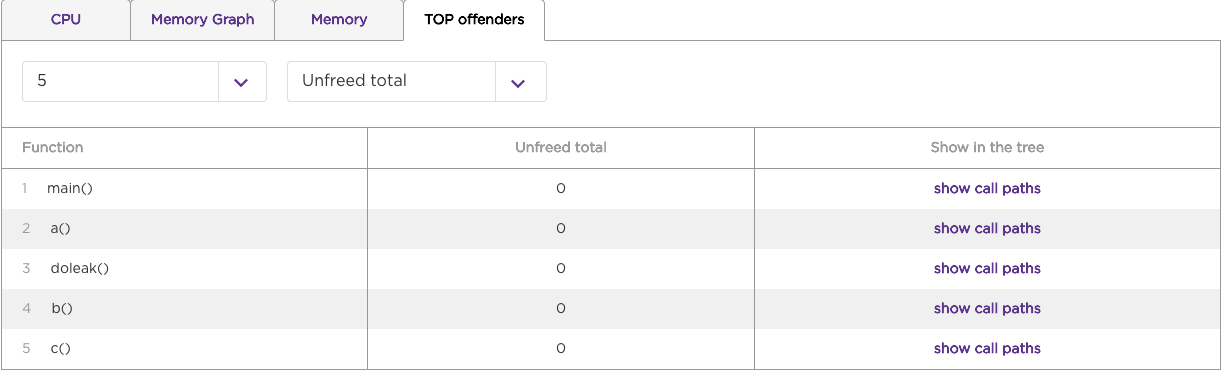
Click Show call paths to open the CPU or Memory tab with more detailed profiling data for the selected function and metric.
Using this data
Here are a few key points on how to use this data to improve channel performance:
| Data Type | Definition and Best Use |
|---|---|
| High wall-clock time but low CPU time | This pattern shows a function is consistently waiting, whether it be for input or a response from an external source. These functions are best suited for Task nodes so that it doesn't block the main thread. |
| Complex functions | Try to simplify the functions as much as possible. If a function handles multiple tasks, consider breaking it out into several functions to further isolate how much CPU or wall-clock time is consumed by each task. |
| Functions that consume a large amount of CPU or wall-clock time | Try to reduce the number of calls to these functions as much as possible. Move functions to Task nodes, if they are consistently waiting. A function can be determined to be waiting if it's wall-clock time is high, but its CPU cost is low. |