Table of Contents
This section of the tutorial shows the sequence that several renderable nodes are drawn on the screen, and the general concepts of inheritance of properties in child nodes from parent nodes. You'll see how to organize a node tree to achieve specific effects, and the behavior of the resulting SceneGraph scene.
Z-Order Rendering Markup
Example Applications: ZORectanglesExample.zip, ZORenderablesExample.zip
By default, renderable nodes are drawn on the screen in z-order, that is, the first node defined at the top of the SceneGraph XML file is drawn first, the second node down is drawn second, and so forth.
For renderable nodes that occupy all or part of a display screen area already occupied by another renderable node, the node drawn last is drawn on top of the previously drawn node. This means that a node drawn first because it was at the top of the XML node tree will be partially or completely covered by successively-drawn nodes lower in the XML node tree.
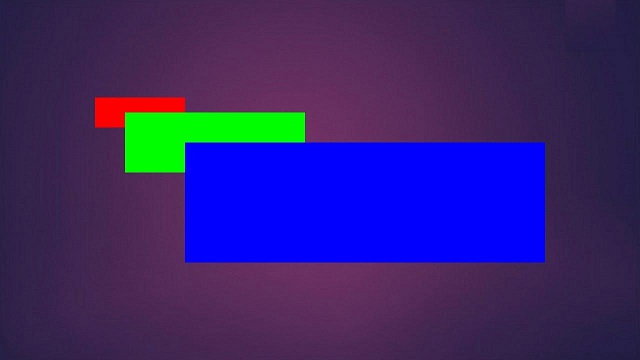
Just to illustrate this concept, ZORectanglesExample.zip draws three Rectangle nodes of successively larger sizes and different colors overlapping each other in z-order. Note that because this is a component extended from a scene node, we must use a Group node to contain multiple renderable nodes in the <children> element:
This node tree results in this SceneGraph scene:
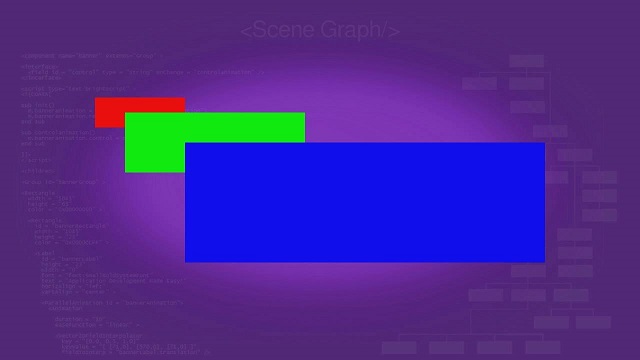
Note that the Rectangle node drawn last, the largest blue rectangle defined last in the XML node tree, is partially drawn on top of the next highest defined rectangle, the medium-sized green rectangle. The smallest red rectangle, because it was drawn first as the first rectangle defined in the node tree, is partially covered by the green rectangle.
This allows you to do things like "reveal" first-drawn nodes by "fading out" later-drawn nodes using an Animation node to control the opacity field of the node...but we're getting slightly ahead of ourselves here.
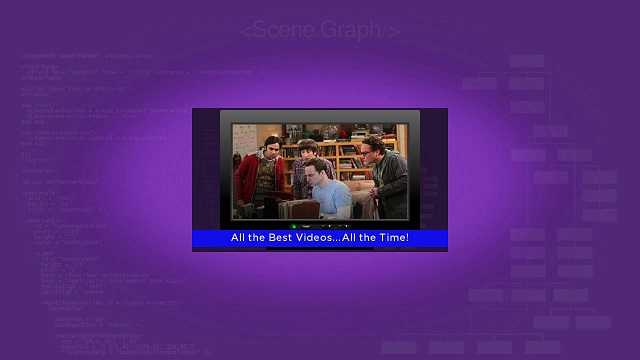
So let's step back and see how some of our previous renderable node classes (Rectangle, Label, and Poster from Renderable Node Markup) could be combined by drawing them in z-order. Download and side-load ZORenderablesExample.zip, which has the following SceneGraph node tree XML markup:
<children>
  <Group id = "exampleRenderables" >
    <Poster
      id = "examplePoster"
      width = "512"
      height = "288"
      uri = "http://sdktestinglab.com/Tutorial/images/videopg.jpg" />
    <Rectangle
      id = "bottomRectangle"
      translation = "[ 0, 244 ]"
      width = "512"
      height = "34"
      color = "0x1010EBFF" />
    <Label
      id = "bottomLabel"
      translation = "[ 0, 244 ]"
      width = "512"
      height = "34"
      font = "font:SmallBoldSystemFont"
      text = "All the Best Videos...All the Time!"
      horizAlign = "center"
      vertAlign = "center" />
  </Group>
</children>
The result is:

Again, because the Poster node was drawn first, it is partially covered by the Rectangle node, which itself is partially covered by the Label node, drawn second and last respectively. But there's a more interesting way to achieve the same effect...
Parent-Child Grouping Markup
Example Application: PCRenderablesExample.zip
The real power of SceneGraph markup is seen when you group nodes together for complex effects. As described in SceneGraph XML Reference, you can group nodes together using the Group node class, or by adding child nodes to a node in the XML markup (you can also manipulate the parent-child relationships of a SceneGraph object using BrightScript). For example, you could use a Group node to achieve the exact same screen display as seen above, but with a somewhat different XML markup:
<children >
  <Group id = "exampleRenderables" >
    <Poster
      id = "examplePoster"
      width = "512"
      height = "288"
      uri = "http://sdktestinglab.com/Tutorial/images/videopg.jpg" >
      <Rectangle
        id = "bottomRectangle"
        translation = "[ 0, 244 ]"
        width = "512"
        height = "34"
        color = "0x1010EBFF" >
        <Label
          id = "bottomLabel"
          width = "512"
          height = "34"
          font = "font:SmallBoldSystemFont"
          text = "All the Best Videos...All the Time!"
          horizAlign = "center"
          vertAlign = "center" />
      </Rectangle>
    </Poster>
  </Group>
</children>
This results in the exact same screen display as in ZORenderablesExample.zip:

But can you see the differences in the XML markup?
The Rectangle node we saw in ZORenderablesExample.zip is still placed at the X,Y screen coordinates of 0,244 as defined in the translation field, but this time as a child node of the Poster node. And the Label node is now defined as a child node of the Rectangle node. This causes the Rectangle node to inherit the translation field values of the Rectangle node, which means we don't need a translation field at all for the Label node (unless we wanted to offset the Label node further from the Rectangle node translation coordinates, which are transformed to 0,0 in the Label node).
One advantage of this is that you can move a group of renderable nodes anywhere on the screen by setting the translation field of the group, and all the renderable nodes are automatically placed in their respective position in the group on the screen. And that is exactly what happens when we center the example in the init() function, which we've been doing all along in this tutorial:
example = m.top.findNode("exampleRenderables")
examplerect = example.boundingRect()
centerx = (1280 - examplerect.width) / 2
centery = (720 - examplerect.height) / 2
example.translation = [ centerx, centery ]
We've been using the findNode() method to create an example object, then we find the dimensions of the example object using the boundingRect() method. To find the X,Y screen coordinates to center the example in the display screen, we subtract the dimensions of the example from the HD UI resolution screen dimensions these examples are designed for, and divide the results by 2. Finally, we set the X,Y screen coordinate results in the example object translation field. All of the various renderable nodes in the example are automatically correctly positioned in the center of the display screen.
But as described in SceneGraph XML Reference, it is not only the position of a group of renderable nodes that can be changed, but several other factors as well.
Parent-Child Inheritance Markup
Example Application: PCRectanglesInheritExample.zip
Let's look at another way to combine renderable nodes together in a group, but with some important differences. Remember the Rectangle nodes we defined in z-order in Z-Order Rendering Markup? Here's some XML markup that shows how to define successive levels of parent-child node relationships, using the same size and color rectangles as before:
<children>
  <Group id = "exampleRectangles" >
    <Rectangle
      id = "lowestRectangle"
      width = "180"
      height = "60"
      color = "0xEB1010FF" >
      <Rectangle
        id = "middleRectangle"
        translation = "[ 60, 30 ]"
        width = "360"
        height = "120"
        color = "0x10EB10FF"
        opacity = "0.5" >
        <Rectangle
          id = "highestRectangle"
          translation = "[ 120, 60 ]"
          width = "720"
          height = "240"
          color = "0x1010EBFF"
          opacity = "0.25" />
      </Rectangle>
    </Rectangle>
  </Group>
</children>
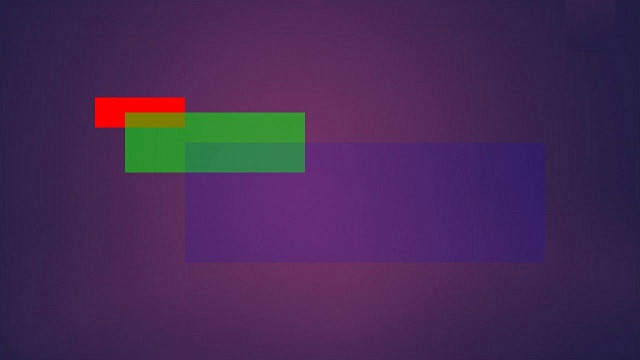
This markup puts the rectangles in exactly the same position as before, but the way they are positioned is different than in previous examples, and just to make it more confusing we've added some opacity fields. The result is this:
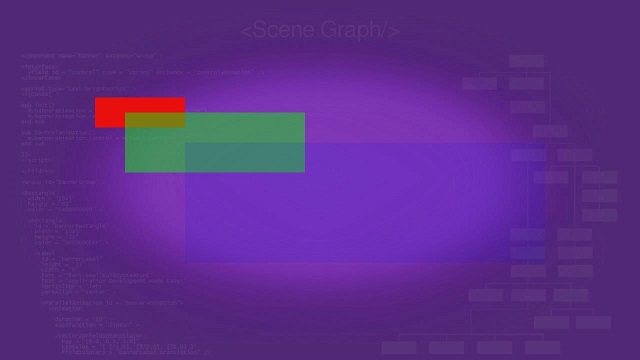
The z-order rendering of the rectangles is the same as for other methods of grouping renderable nodes together, the blue rectangle defined last is drawn on top of the green rectangle. But it's almost impossible to see the blue rectangle!
That's because in this method of grouping nodes together, where nodes are defined as a child of the previous parent node, the last node defined inherits its characteristics from the previous node. That node in turn inherits its characteristics from its parent node, and so forth. The various fields you can define for a child node are either added to, or multiplied, by the corresponding field in the parent node. This is the same as how nodes in a Group node define their translation fields as offsets from the Group node translation field definition (see Parent-Child Grouping Markup).
In looking at the XML markup, we can see that the first parent node defined, the red rectangle, does not have a translation field defined, meaning that the default X,Y screen coordinate values of 0,0 will be used.
This means the screen position for the next child node, the green rectangle, is defined as an offset from the red rectangle screen coordinates:
translation = "[ 60, 30 ]"
So the child node green rectangle is offset 60 pixels to the right, and 30 pixels down from the position of the parent node red rectangle. Then another node for the blue rectangle is defined as a child of the green rectangle, so its screen coordinates are an offset from its parent node, the green rectangle:
translation = "[ 120, 60 ]"
So the blue rectangle is offset 120 pixels to the right, and 60 pixels down from the green rectangle. So why is it almost invisible?
Note that we added an opacity field to the green rectangle definition.
opacity = "0.5"
As described in the SceneGraph XML Guide, opacity is the inverse of transparency, ranges from 0.0 (completely transparent) to 1.0 (completely visible - opaque), and is a definable field for all renderable nodes, because they are derived from the Group node class. So if a renderable node has an opacity field definition of 0.5, it is half transparent, like the green rectangle (note the lowest red rectangle shows through the green rectangle).
In this example, the blue rectangle is a child of the green rectangle with its own opacity field definition:
opacity = "0.25"
Remember that the characteristics of child nodes are based on the corresponding characteristics of their parent node. In this case, the opacity of the blue rectangle is based on the 0.5 opacity of its parent green rectangle...but since it has its own opacity definition of 0.25, that 0.25 definition is multiplied by the 0.5 opacity definition of the green rectangle, resulting in an effective 0.125 opacity definition for the blue rectangle.
This is why the blue rectangle is almost invisible, despite being in front of the other rectangles in z-order. It inherited, and then further increased, its own lack of visibility.
Now that you understand all of that, we can move on to making renderable nodes move around and even gradually disappear from the screen...